Multinuclear NMR Spectroscopy
Multinuclear NMR spectroscopy is the name given to the study of NMR active nuclei of elements other than just 1H (proton) or 13C (carbon). In fact the second most sensitive nucleus for NMR work is ... 19F! Our research has resulted in us obtaining a wide range of fluorine spectra, and of other nuclei, below you will find examples of 19F, 31P, 77Se, 119Sn, 199Hg data amongst others. Since this is an area not well covered in standard NMR textbooks, we also provide some of the relevant background/theory and calculators, such as the interactive Pascal's triangle j-coupling pattern calculator, on our nmr primer page.
These pages are slowly evolving, they will be expanded to include new spectra, data and relevant links, as they become available to us. Note: In most cases clicking on a spectrum will display a larger version.]
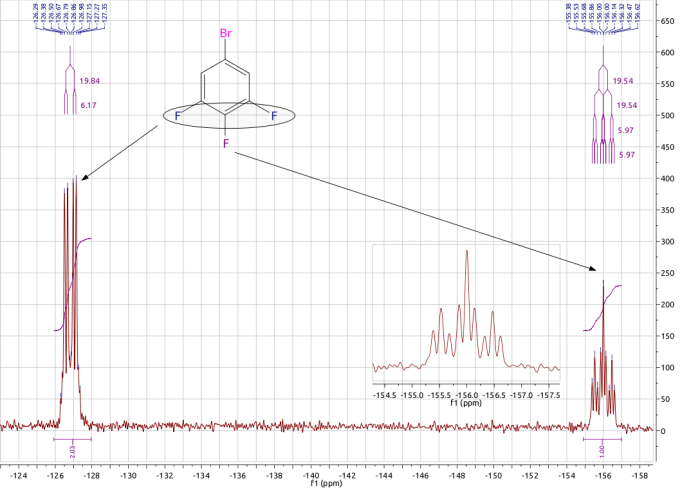
The 19F NMR spectra of C6F3H2Br.
The spectrum below was obtained for a sample of the partially fluorinated aromatic compound 1-bromo,3,4,5-trifluorobenzene. In this molecule there are two different chemical environments for the fluorine nuclei, that is the fluorine atoms in the 3 and 5 positions (blue in the diagram) are in one similar environment, while the C-4 fluorine (para to the bromine) is in its own unique environment. Consider either F-3 or F-5, this nucleus will couple with the adjacent F-4 nucleus, to give a doublet, and also with the neighbouring proton, which splits this signal again to generate a doublet of doublets. The single, unique fluorine, F-4, will couple with the two equivalent fluorine nuclei (F3 and F5) to give a triplet, and also with the two chemically equivalent protons so this signal appears as a triplet of triplets.
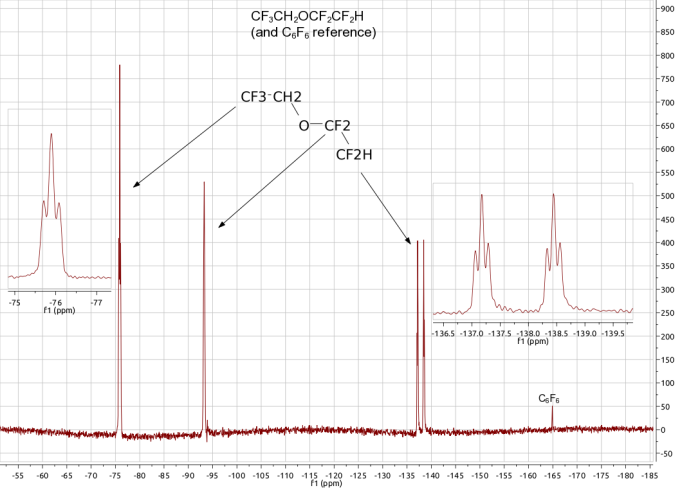
The 19F NMR spectra of CF3CH2OCF2CF2H.
The spectrum below is for the fluoroether compound shown in the picture below. Because of free-rotation around the C-C bonds there are three different chemical environments for the fluorine nuclei; the CF3 group, the OCF2 fluorines and the CF2H fluorines. Consistent with this the spectrum shows 3 signals, in the relative intensity ratio (integrals) 3:2:2. The first of these signals, a ca. -75 ppm, is a triplet because of coupling to the adjacent 2 protons [2nI+1 => triplet]. The most negative signal, at ca. -137 ppm, is a doublet of triplets (see expansion) which arises from coupling to the singlet proton (to give a doublet) and then the two fluorine nuclei on the neighbouring carbon (to give the triplet part of the pattern) so generating a doublet of triplets overall. The middle signal arises from the two fluorines of the central OCF2 group.
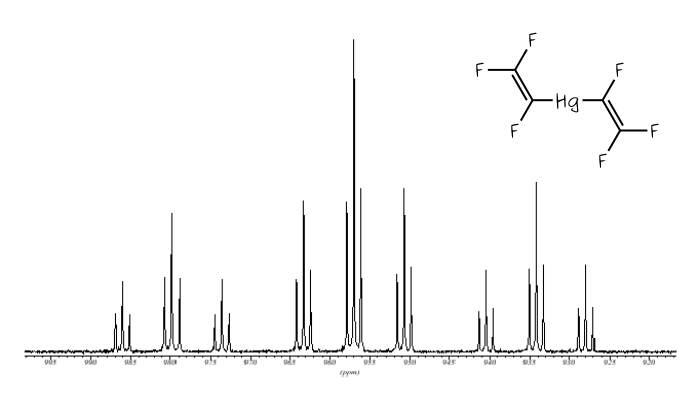
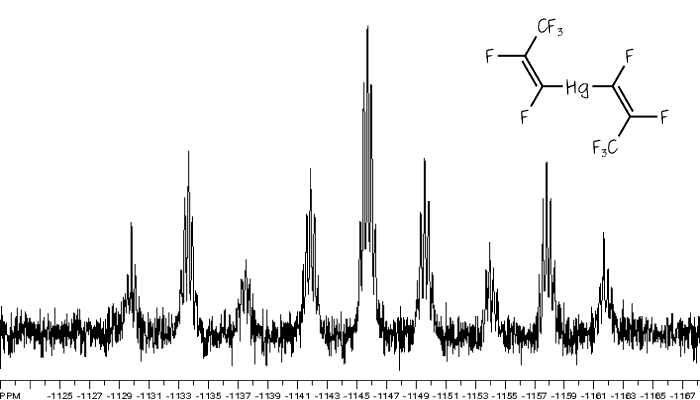
The 199Hg NMR spectra of Hg(CF=CF2)2 and Hg(CF=CF(CF3))2.
The spectrum below is of Hg(CF=CF2)2, also shown below. In this molecule all three fluorines of each trifluorovinyl group are chemically inequivalent to each other, but the same either side of the mercury centre, so the mercury signal is split into a triplet of triplet of triplets. [Click on the spectrum to see a larger version.]
The 199-Hg NMR spectrum shown below is for Hg(CF=CF(CF3))2. Compared with the molecule above, one of the fluorines of each group has been replaced by a CF3 group, so now the coupling pattern is a triplet of triplet of septets. However, the septet coupling is not very well resolved, even in the most intense, central portion of the spectrum the weakest outer lines (1:6:15:20:15:6:1) of the septet are difficult to pick out.
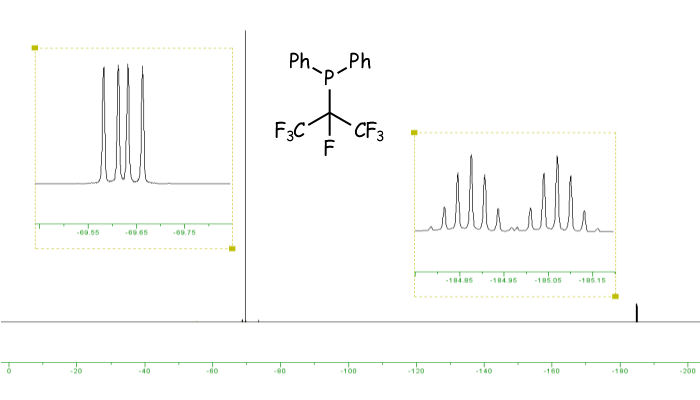
The 31P and 19F NMR spectra of Ph2P(i-C3F7).
The spectra below are for a sample of Ph2P(i-C3F7). In this molecule there are two fuorine environments in the ratio 1:6, so the 31P NMR spectrum is a doublet of septets, as shown below. [Click on the spectrum to see a larger version.] However these are not completely separated, so there is some overlap in the centre of the pattern. The 19F NMR spectrum has two signals, reflecting the fact that there are two fluorine environments. The intense peak is due to the six fluorine nuclei of the two CF3 groups, which couple to the other fluorine, and the phosphorus to give a doublet of doublets. The weaker signal arises from the unique single fluorine environment, which shows coupling to the phosphorus and the six fluorines of the CF3 groups, so appears as a doublet of septets.
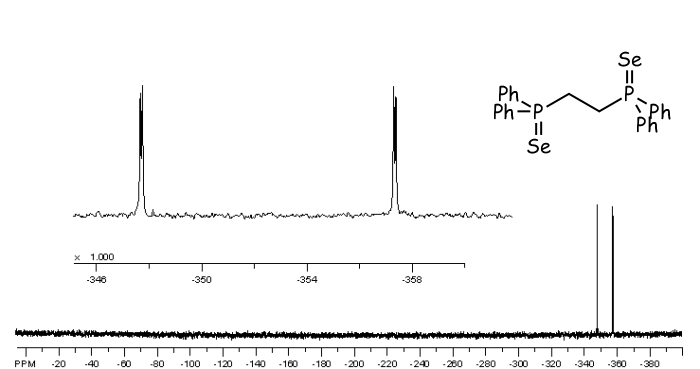
77Se NMR spectrum of Ph2P(Se)CH2CH2P(Se)Ph2.
The selenium NMR spectrum of the selenide of dppe bis(diphenylphospino)ethane is shown below. 77Se is of low abundance, only 7.6% (or 0.076), so there is the possibility of a molecule possessing either none, one or two Se-77 nuclei. The probability of these can be calculated in the following way:
Neither selenium is 77: 0.924 x 0.924 = 0.854, or 85.4%
One selenium is 77:     2 x 0.076 x 0.924 = 0.140 or 14%
Both seleniums are 77 : 0.076 x 0.076 = 0.006 or 0.6%
Of course when neither selenium atom is 77Se there can be no 77-Se NMR spectrum. Conversely, the chance of both seleniums being 77Se is so low (0.6%) that we can effectively ignore it. This leaves us with the molecules in which one of the two seleniums is spin-active. In such molecules the two phosphorus atoms will be different - one is connected to a spin-active selenium, the other is not, so the selenium NMR signal is split into a widely separated doublet by the phosphorus nucleus to which it is directly bound (1J(SeP)) and also by the more distant, other phosphorus nucleus (4J(SeP)), so a doublet of doublets is observed, as shown below.
13C NMR spectrum of Bu3SnI
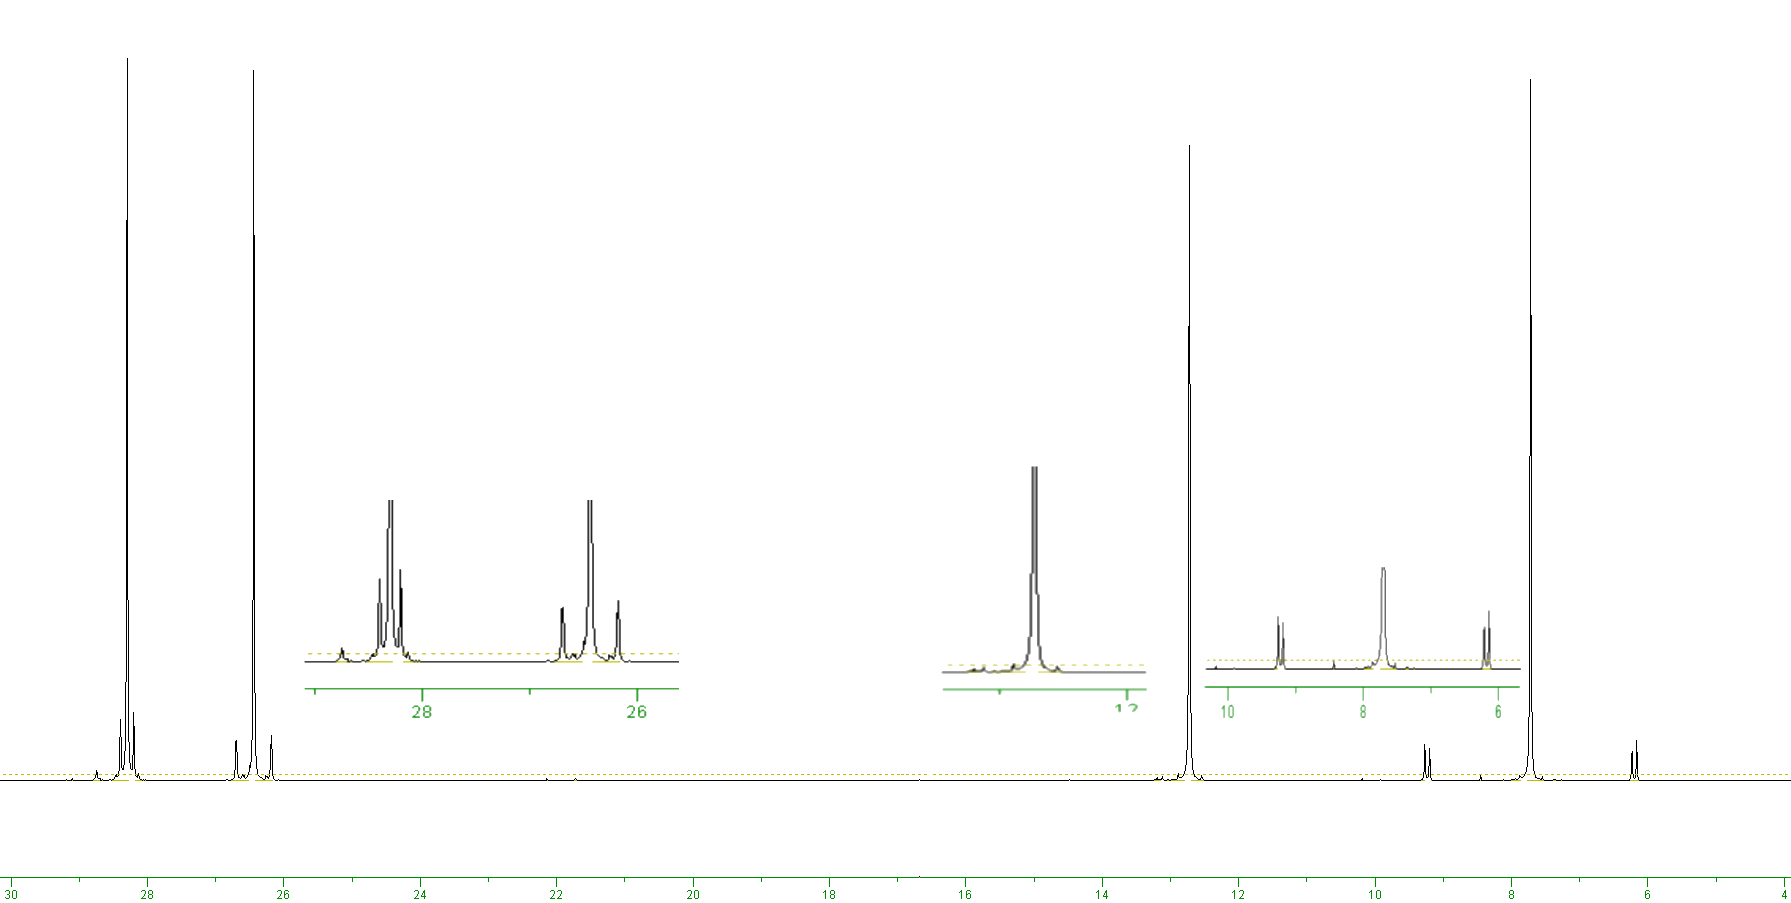
The carbon-13 NMR spectrum shown below is of tributyltin iodide. Tin has two low abundance spin-active nuclei, these are 119Sn and 117Sn, with relative abundances of 8.6 and 7.7% respectively. Both of these nuclei are spin I = 1/2. This means that each spin-active carbon nucleus could couple to a 119Sn nucleus, so generating satellites either side of the main peak, or a 117Sn nucleus, also giving rise to a set of satellite peaks. Looking at the signal at approximately 6 ppm you can see both of these satellites. The outer lines (the ones furthest from the central peak) are very slightly more intense than the inner pair of lines - so the outer lines are the 119Sn satellites (8.6%) and the slightly weaker set are due to coupling with 117Sn (7.7% abundant). [Remember that the coupling constant is measured from one satellite peak to the other either side of the main peak.] The total intensity of the central peak will correspond to when there is neither of the spin-active tin nuceli present, i.e. 100 - (8.6 + 7.7) = 83.7%.
On the remaining peaks it is not possible to see the two separate set of satellites as the carbon-tin coupling constants become smaller for the carbons more distant from the tin nucleus. So the peak at ca. 26 ppm clearly shows the tin satellites, while these peaks are only just visible on the signal at ca. 28 ppm and cannot be seen at all on the carbon signal at 13.5 ppm. We can use this coupling information to help assign the 4 signals; the one with the largest coupling constant at ca. 8 ppm is due to the CH2s attached directly to the tin, the next CH2 is at 26 ppm (since it has the next largest carbon-tin coupling), while the last CH2 corresponds to the signal at 28 ppm, and the methyl group is the signal at 13.5 ppm.
Links to other sites
The following sites are worth a visit:
- Site with spectra and data for a wide range of spin-active nuclei
- SpinWorks an excellent free piece of software for analysing NMR data on PCs, and runs under Windows or Wine on Linux, from Kirk Marat (used to generate most of the pictures on this page)
- Mnova is a very impressive commercial program for NMR data analysis which runs natively on Windows or Linux. An older, free, version is also available Mestre-c 2.3


![Helical structure of cis- trans-[PtBr2{PiPr2(CF=CF2)}2] The crystal packing diagram of [PtBr2{iPr2P(CF=CF2)}2]](/rotator/CisTrans.png)

![Fluorous dominated structure of [AuCl{Et2P(CF=CF2)}] The crystal packing diagram of [AuCl{Et2P(CF=CF2)}]](/F_News/aurophilicity.png)
